
The Emissions Deception Cookbook
[This is a republication of a Twitter thread I posted here. I’ll update this post when the emissions data comes out!]
Folks, I’d like to expand on Tim Baxter’s great thread here – basically predicting how the looming update on Aus emissions data will be spun … (first, read Tim’s thread, then come back to mine).
Here’s the Iron Law of Australian climate pol -> All this has happened before, and all this will happen again. So, Shall We Begin?
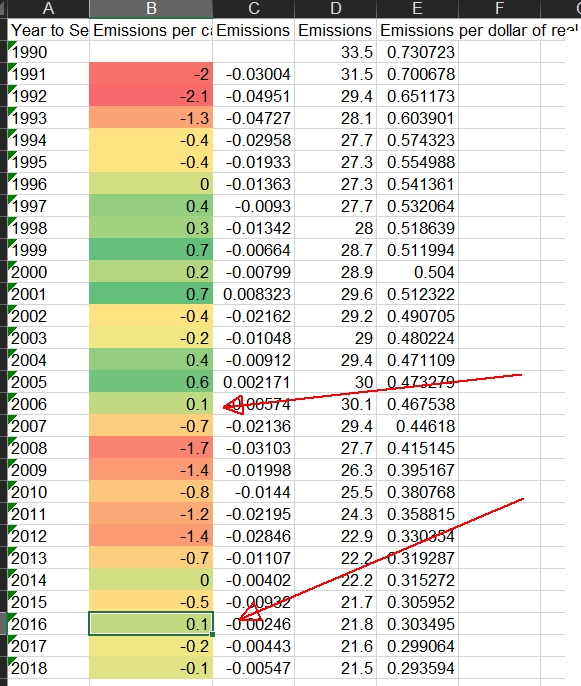
TACTIC #1 – Switching between unadjusted and adjusted figures depending on which one shows a decrease.
The Australian Department of Environment presents emissions in two ways: raw figures, and ‘adjusted’ – to try and control for variations in seasons, electricity demand, ‘extreme’ days etc. This is what the two lines look like. Notice the little drop in the orange line, on the most recent data? That was presented, by [current ‘Energy and emissions reduction Minister] Angus Taylor, as emissions ‘trending downwards’.
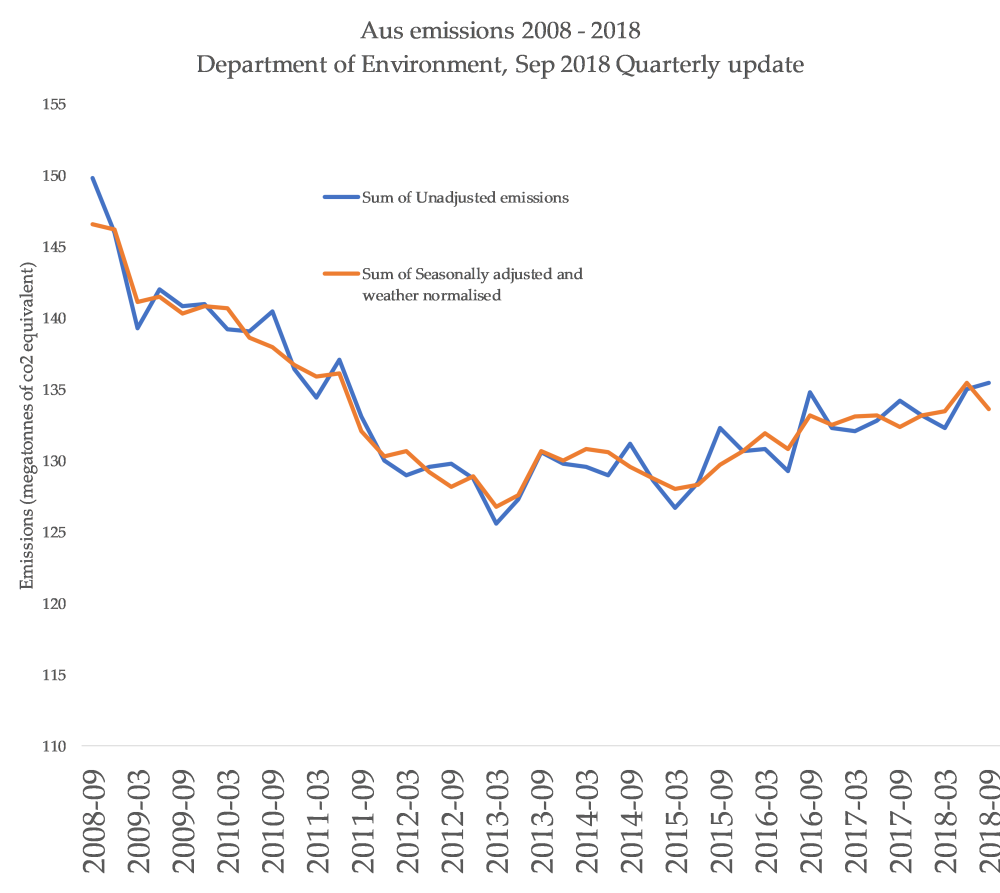
Here’s Taylor on the ABC’s Insiders program, insisting that this shows emissions are falling:
This time, it’ll probably the inverse – ‘unadjusted’ will show a fall – because the Dec quarter consistently decreases from the previous due specifically to the seasonal variation that the ‘adjusted’ is meant to correct for.
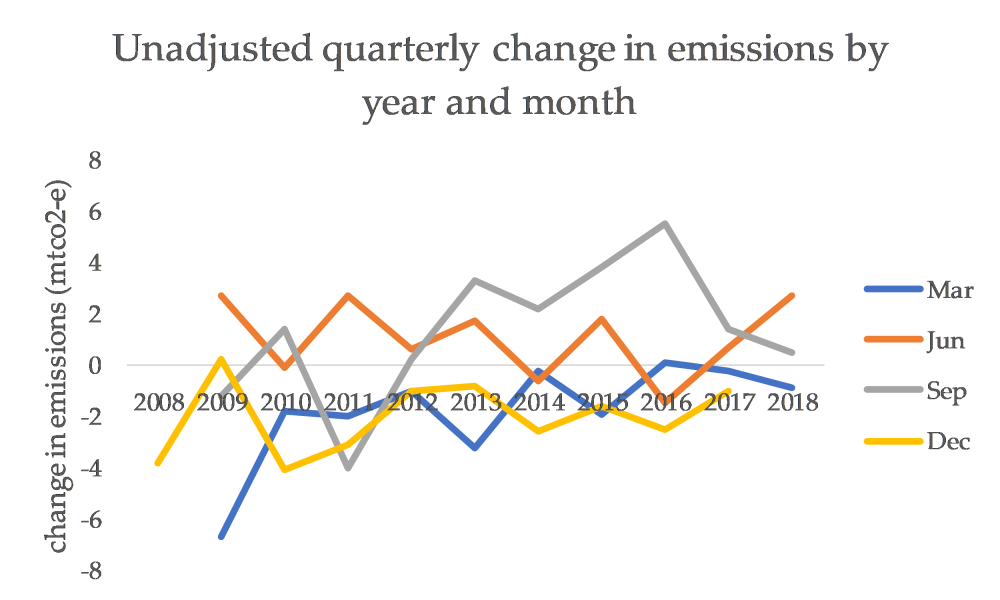
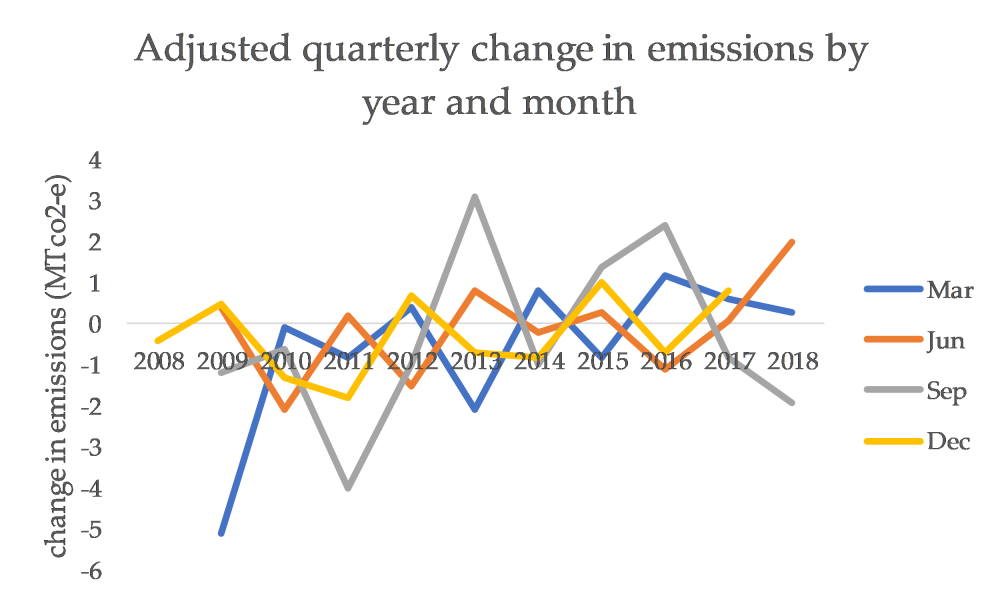
Split out the quarterly variations by month, and by whether they’re adjusted or not adjusted, and you can see how
a) December unadjusted is almost always a decrease (yellow line, first chart)
b) there’s usually one option for spinning a ‘downwards trend’, by cherry-picking.
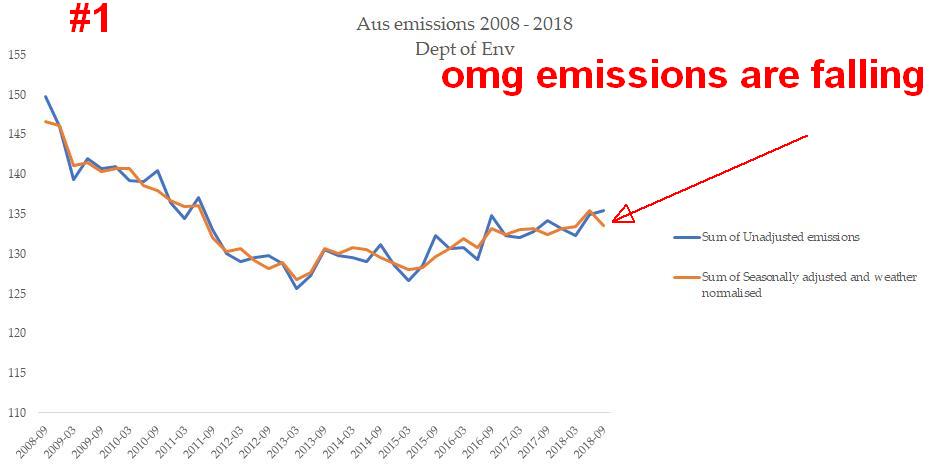
TACTIC #2 – Only use comparisons to previous quarters, because that’s the most likely to obscure long term trends
Previous energy minister Josh Frydenberg has been doing this for a while. The September 2017 (adjusted, of course – the unadjusted values were up, see Tactic #1) data showed ‘the biggest quarterly drop in four years’ – wow! Joshy!
Except….in retrospect, that seems laughable on the long-term chart.


More recently, ex-environment Minister Melissa Price said the media was “cherry picking” because the approach of focusing narrowly on quarter-on-quarter comparisons was being criticised:
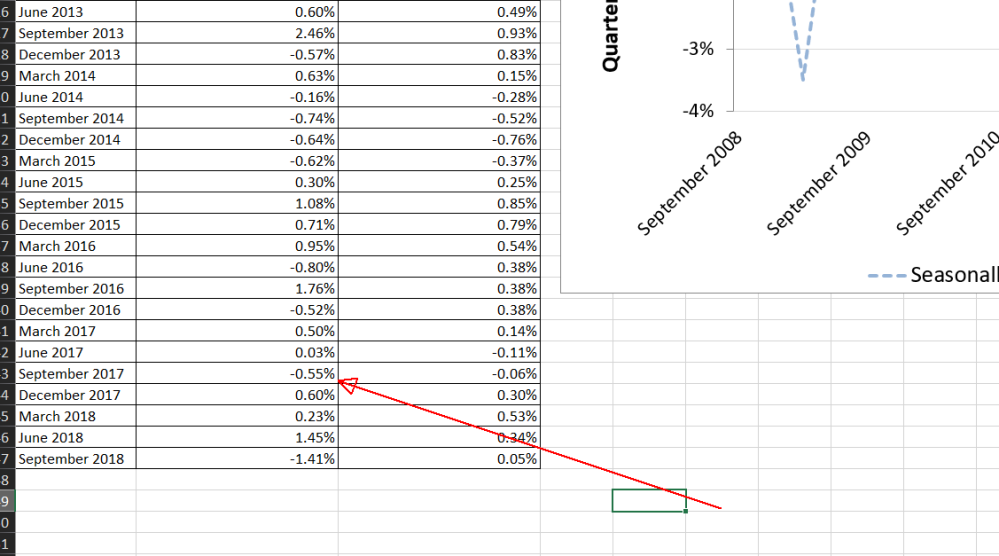
Here’s one I prepared earlier, demonstrating how quarter-on-quarter comparisons are noisy enough to provide infinite fodder for politicians trying to obscure a trend:

Here’s the thing: if you look at year-on-year comparisons (orange chart) (eg each quarter compared to the same quarter last year), it becomes stunningly clear why this is the tactic of choice for trying to mislead Australians into thinking emissions are falling.


TACTIC #3 – An excessive focus on per-capita figures falling
Here’s Angus Taylor again, in a very weird and circular interview on Channel Ten’s The Project, talking about how emissions per person in Australia are falling:
And, down the memory hole again, here’s Josh Frydenberg saying almost precisely the same thing:

Here’s the thing: like every other tactic, it’s literally true, but deeply misleading. First – here’s the data the Department of Environment tends to put front and centre in their quarterly updates – and they’ll do the same for this week’s update, I guarantee it.

“The atmosphere doesn’t care how many people are contributing to emissions; it’s the total quantity of emissions that matters” – this is why our Paris and Kyoto targets aren’t per-capita targets, they’re raw emissions figures.
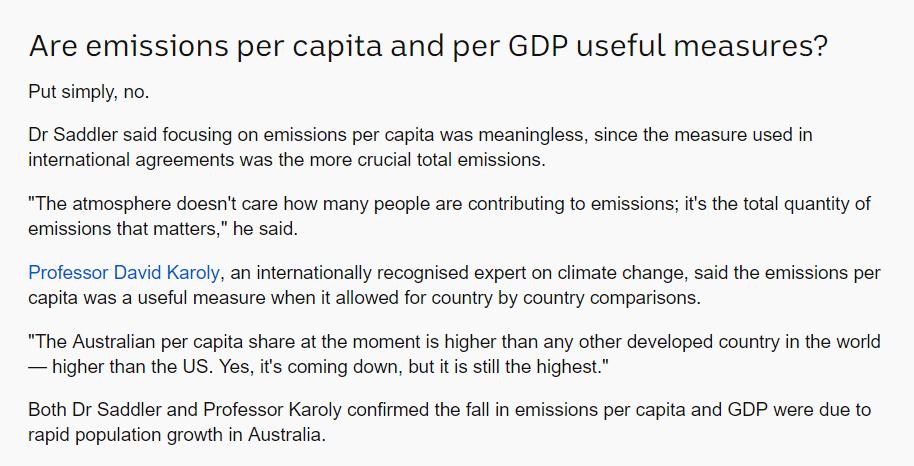
Aus’ population is growing faster than emissions are rising. Which, look, great. That’s better than rising emissions per capita, or per GDP.
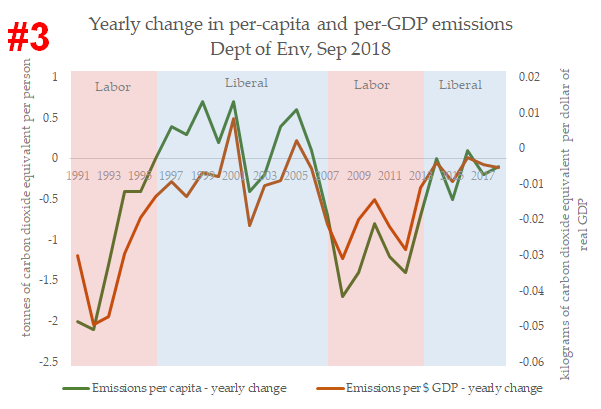
But things start to get horrible again when you realise Aus is still leading the world in emissions intensity:
Here’s something else I realised, though: the *rate* at which emissions per capita is decreasing has actually massively slowed since the Coalition came to power. And this seems to be a relatively consistent thing.
In fact, soon, it might start rising again:

2016 actually saw Australia’s first slight **increase** in emissions per-capita since John Howard’s reign in 2005. How did that slip under the radar?
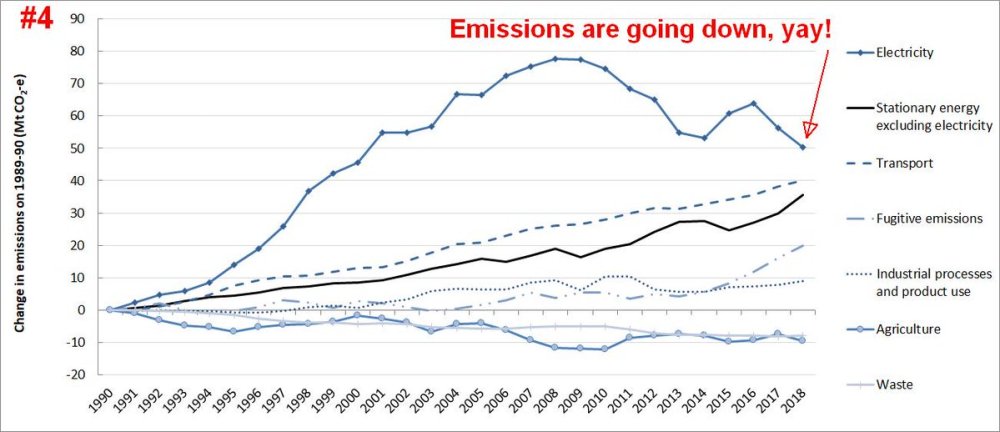
TACTIC #4 – Only focus on the sectors that show falls (usually, electricity)
Again, nicely illustrated by @JoshFrydenberg (thank you, Josh)
Emissions are made up lots of components – electricity, farming, planes, cars, etc. This one is simple: choose one that shows a fall, and ignore the ones that rise.
Also, this tactic is used when looking at *forecasts* of emissions. Taylor loves doing this particular thing. It’s very sneaky.
This particular tactic *really* gets me, because they fought, passionately and intensely, against the policies and the machines that are causing the decreases in emissions intensity in the NEM – namely wind and solar, and the renewable energy target. Now, they’re banking their own failures in abolishing policies and damaging Australian clean tech industries as their *ACHIEVEMENTS*. This is so galling.

Let’s summarise
#1 – Switch between adjusted / non-adjusted to cherry-pick decreases
#2 – Only compare to prev quarters to obscure trends
#3 – Use per-capita measures to distract / confuse
#4 – Cherry-pick sub-categories that show falls
This isn’t an exhaustive list, but jeez, it’s exhausting.
Good-hearted wonks need *your* help – citizens, journalists, activists, etc, in learning these tricks and calling them out with triple the passion and volume of the original deception. So, keep an eye out for Taylor and the department’s emissions data release, and see if you can spot which tactics they go for.
Hugs,
KJ
[Article header image – Angus Taylor at the ‘Stop These Things’ anti-wind farm rally in 2013]

So, if emissions per capita are falling, if we stop all immigration, then our emissions in total will fall. Is this what we want? Remember, if 200 000 people emigrate to Australia every year, they are increasing Australia’s total carbon emissions per year, but decreasing other countries emissions by the same amount. Therefore, countries with lower rates of growth than Australia, will have an easier path to total emissions reductions.
LikeLike