Australia’s blackout politics are topsy turvy
The collapse of transmission lines back in September 2016 triggered a major blackout across the entire state of South Australia. As I detailed in my book, it came at the perfect time for an all-out political onslaught, framing wind farms as the culprit and justifying significant delays in new climate policies and deployment.
That was a long time ago, but the threat of blackouts remains badly misunderstood. Warnings of supply crunches in the near future are met with pleas to build more fossil fuels, despite climate change impacts being the single most prevalent primary cause of power system failures over the past few decades. And as new projections account for a slowdown in renewable energy construction, it seems likely politicians and media outlets will continue to take away exactly the wrong message from modelling of supply adequacy.
The blackout forecast report
Every year (and with occasional updates after release), the Australian Energy Market Operator (AEMO) releases a report they call the ‘Electricity Statement of Opportunities’, or ESOO. In short: they look at projected power demand, they look at what needs to run to meet that demand reliably. They run a set of statistical models based on what’s in the pipeline, and come up with a probabilistic guess of ‘Expected Unserved Energy’, or USE1.
If you’re in Australia reading this, you are right to feel like you probably get more than 10 minutes of blackouts a year. The ESOO report only relates to ‘the big stuff’ – a failure to balance supply and demand. Almost every single household blackout every Australian experiences will be caused by storms, trees or thrill-seeking possums on the local ‘distribution’ network:

For what it’s worth, the actual incidence of these ‘local’ blackouts has been decreased quite significantly on Australia’s various distribution networks, as shown in the latest reliability update:
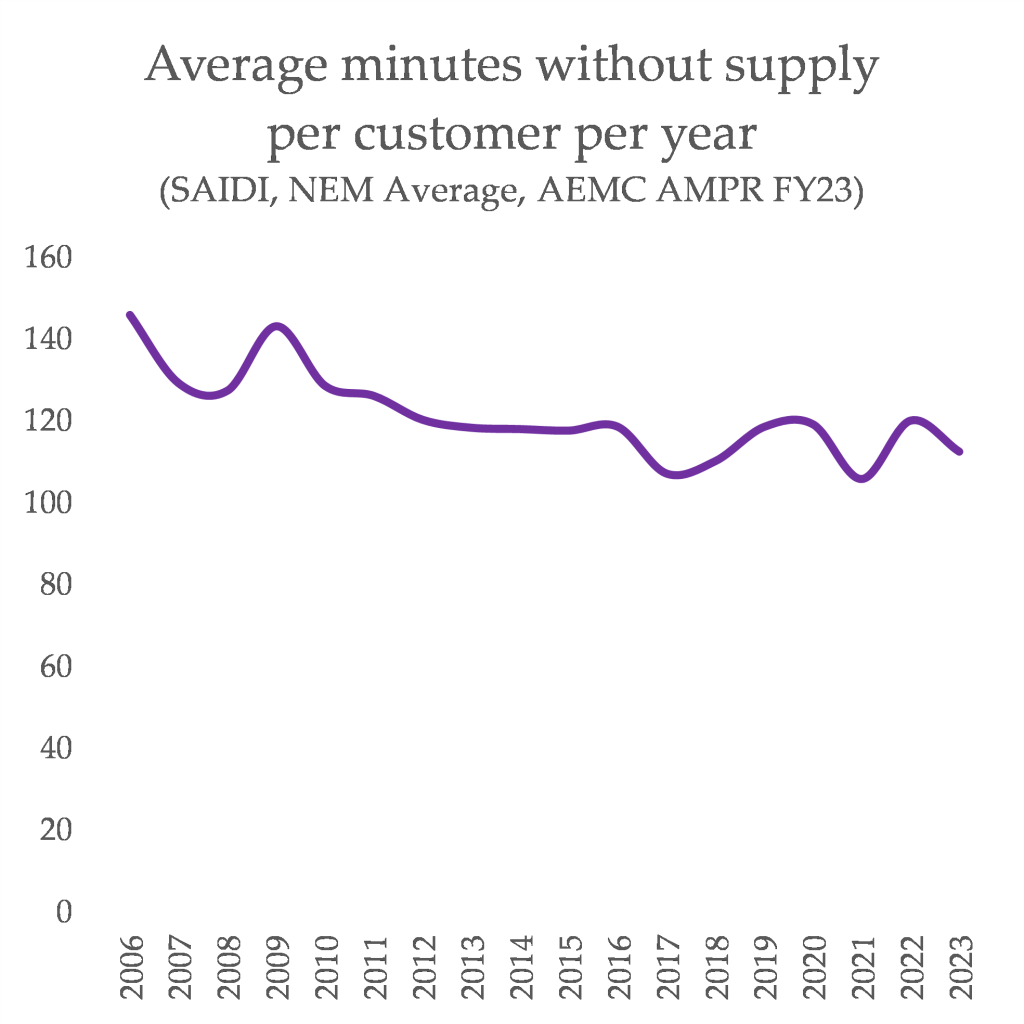
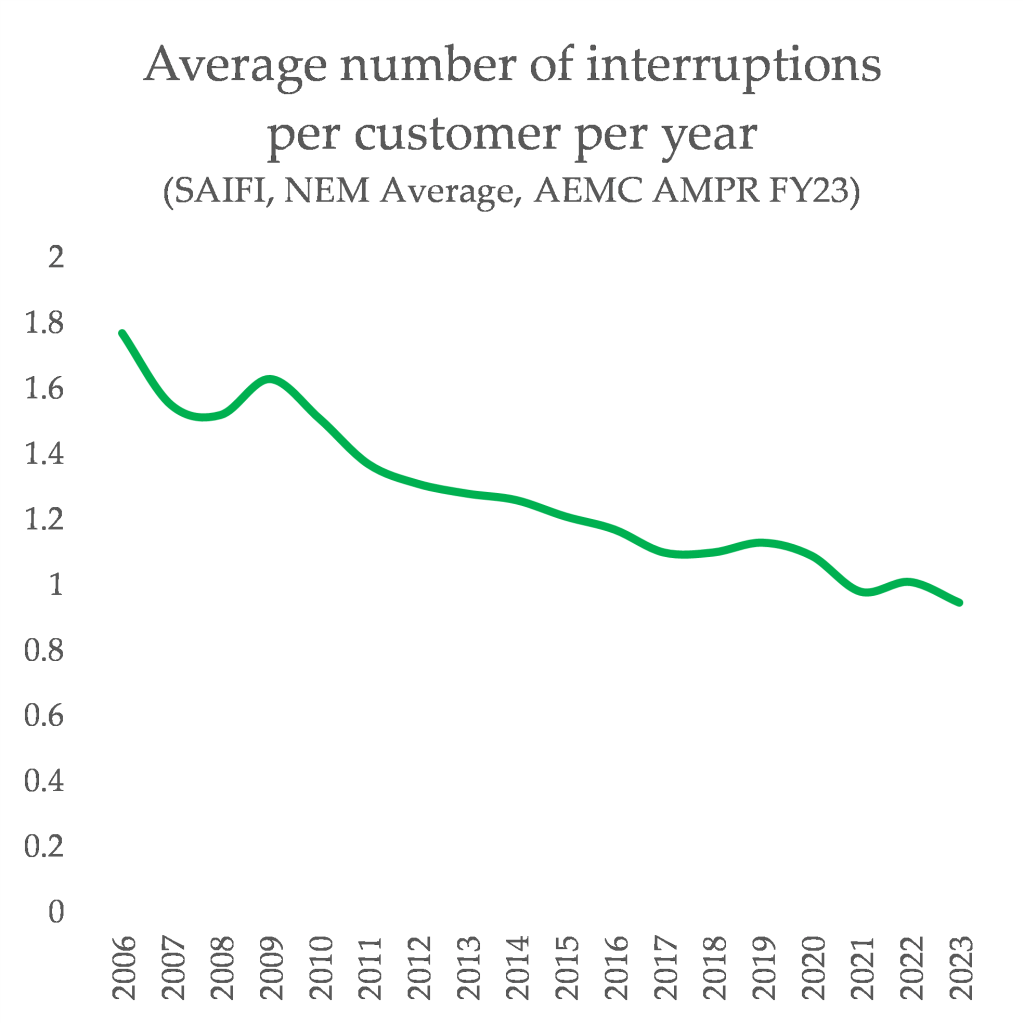
This surprises people. The discourse on blackouts in Australia tends to centre around power supply – particularly the anxiety that an influx of wind and solar generation will wreck the fine balance due to the fact that they can’t be dispatched to meet demand. But most blackouts will relate to local issues.
The release of the ESOO – or updates to it – always worsens these anxieties, and always opens up a wide space for exploitation of these fears by the political parties – the Labor party and the Liberal-National Coalition – to defend and extend reliance on fossil fuels.
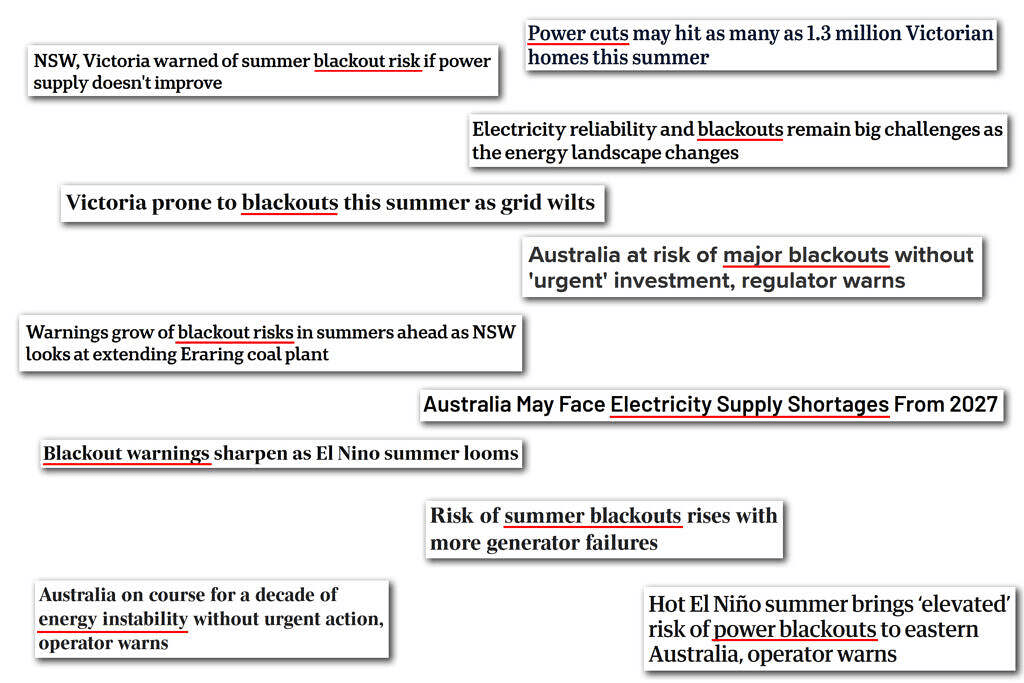
Dan Lee over at WattClarity has written a nice summary of this pattern: the grid operator signals that if we were to stop building anything new, the proportion of supply-related blackouts would rise from [a very tiny number] to [also a tiny number, but bigger than the old one].
As Dan says: “Somehow the release of the ESOO has triggered an annual tradition of journalists and social media commentators misinterpreting its results as a ‘blackout predictor’ of sorts. It is a tradition that is almost as old as the ESOO itself”. He has compiled the headlines into this image – something I guarantee is only a very tiny fraction of the near-identical headlines that flow out when the report is released:
This has also been explored by energy expert Dylan McConnell, here, as he highlights what the media is really calling for is a massive, eye-watering investment in the grid to avoid the chance of a few extra minutes of blackouts. “The media reporting and public comments are tacitly or even explicitly advocating for the generation system to be “gold-plated”, which would come at great expense to consumers”.
For the past month or so, I’ve had a similar idea to Dan, and have been collecting up the raw data2 for every single ESOO report from the past ten years (bar 2014, which did not publish USE data). I also recently discovered that another agency shares the actual percentage of unserved energy for each financial year, for each state.
What this means is that you can compare all of the forecasts to what actually happened. What you can see below is something you would expect: every report that was labelled in the media as projecting a tsunami of blackouts has mostly failed to eventuate, and most years in most states saw zero ‘unserved energy’ at all. This is because the forecast assumes nothing gets built, and it turned out that…….stuff did get built.
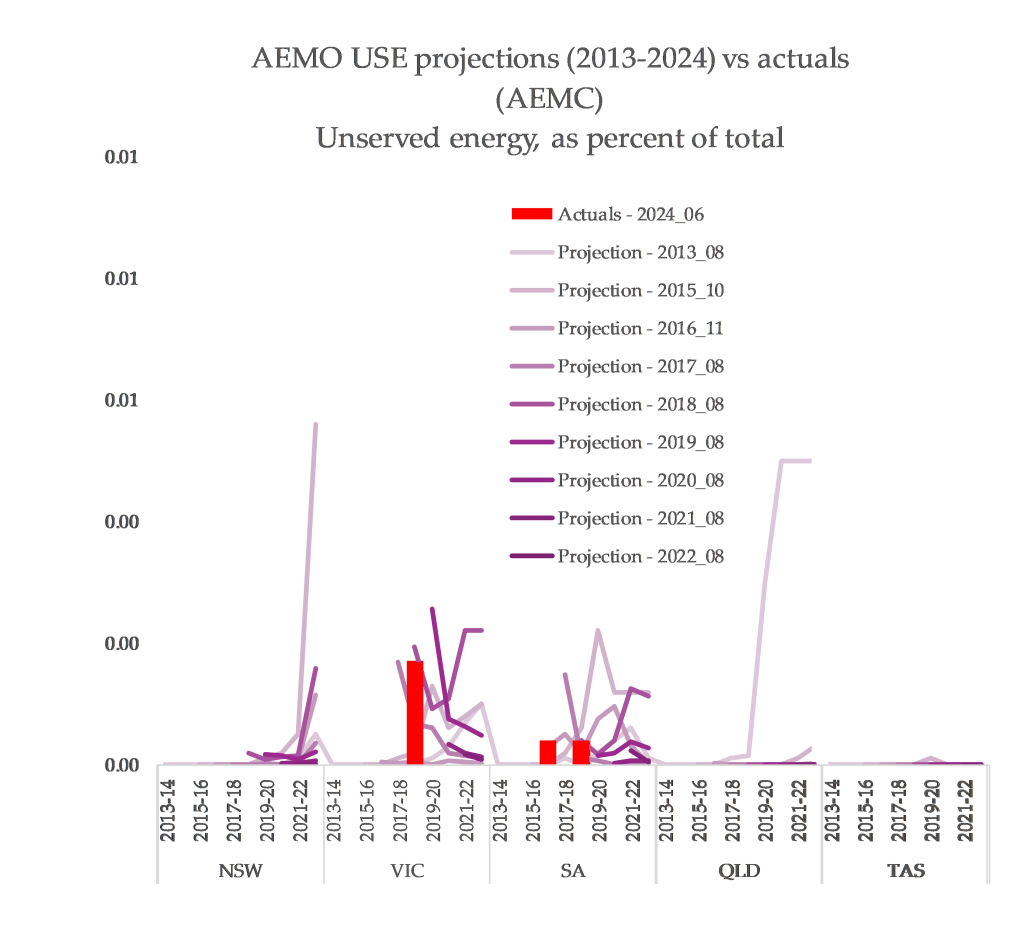
You can see South Australia’s 2016 blackout, alongside a blackout in 2017 caused by fossil fuel climate impacts (an extreme heatwave), and the same in 2019, in Victoria.
It is really significant to me that every event that has ended up on here is directly caused by extreme weather events.3 All three of them were immediately blamed on renewables in media outlets, but in reality, their genesis was in an atmosphere that is becoming increasingly violent thanks to the burning of fossil fuels.
There is one major blackout incident that wasn’t blamed on renewable energy: an extreme heatwave causing load shedding in 2009, which show up more prominently than any other classified USE event when you look at a longer timeframe:

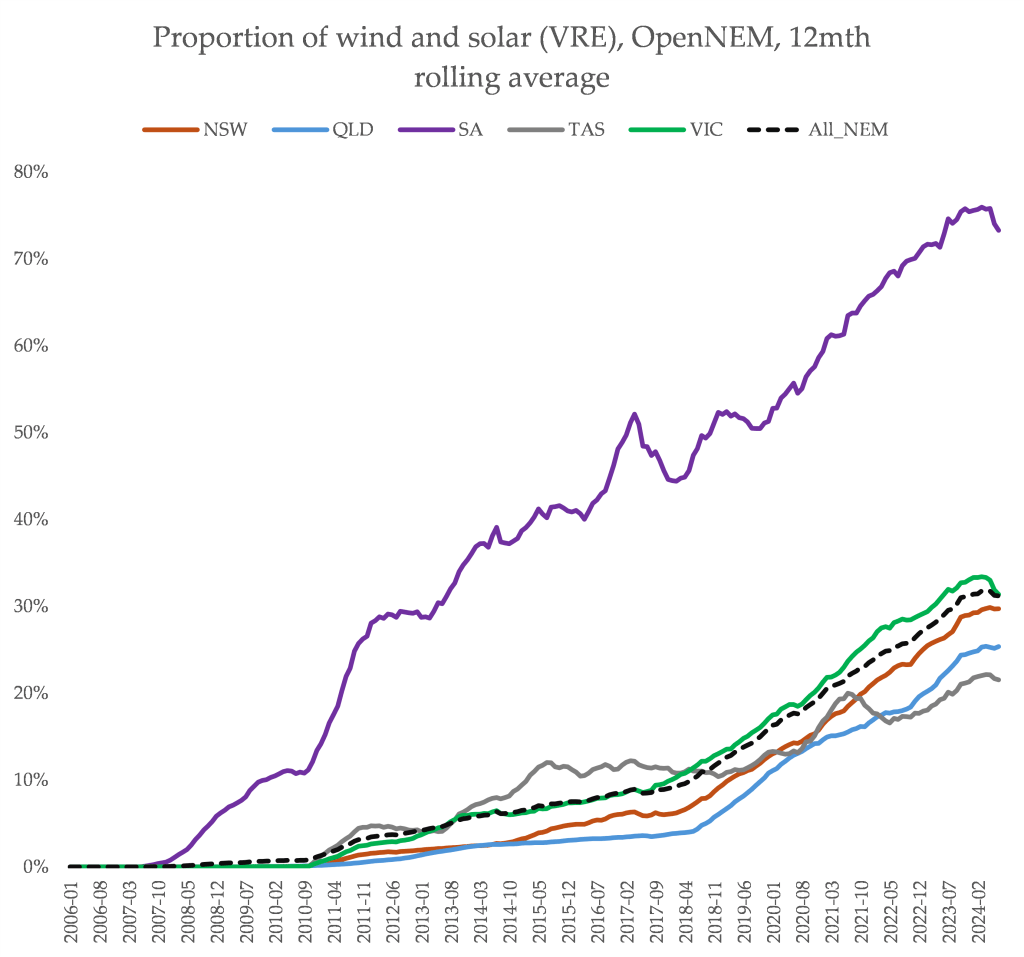
This occurred well before the rise of wind and solar. The proportion of variable renewable energy – wind and solar – has climbed rapidly, particularly across South Australia, Victoria and NSW. Over those years, the number and duration of supply-related blackouts simply hasn’t increased.
Renewable energy did not cause some sort of blackout apocalypse, as was predicted back in the late 2010s, in post-SA-blackout energy politics. It has been the drumbeat of fossil fuel climate impacts that have caused the blackouts conservative pundits warned renewable energy would cause.
As Dan explains at WattClarity: “The report is meant to inform the market, so it is an intentional feedback loop. If it does that, then it has achieved its primary purpose – even if that means that what then unfolds is different than the forecast. This in itself therefore almost guarantees that the reliability outlook will be ‘inaccurate’”.
The ESOO ‘warnings’ have been clumsily communicated in the past, but technically they haven’t been ‘wrong’ – they have been useful. The warning of an impending Y2K software bug crisis were useful too: the reason there wasn’t any Y2K disaster is precisely because the alarm was raised, and action was taken. The warnings of a Y2K crisis weren’t ‘wrong’.
In 2024, the situation has changed. Recent ESOO reports have been reported in the context of their key message: preventing the blackouts requires building a truckload of new wind and solar, along with batteries and transmission lines. It’s a noticeable improvement – but are politicians hearing the message?
What comes next?
Since 2022, AEMO’s ESOO modelling has been spitting out ‘unserved energy’ projections that are way, way higher than the old reports:
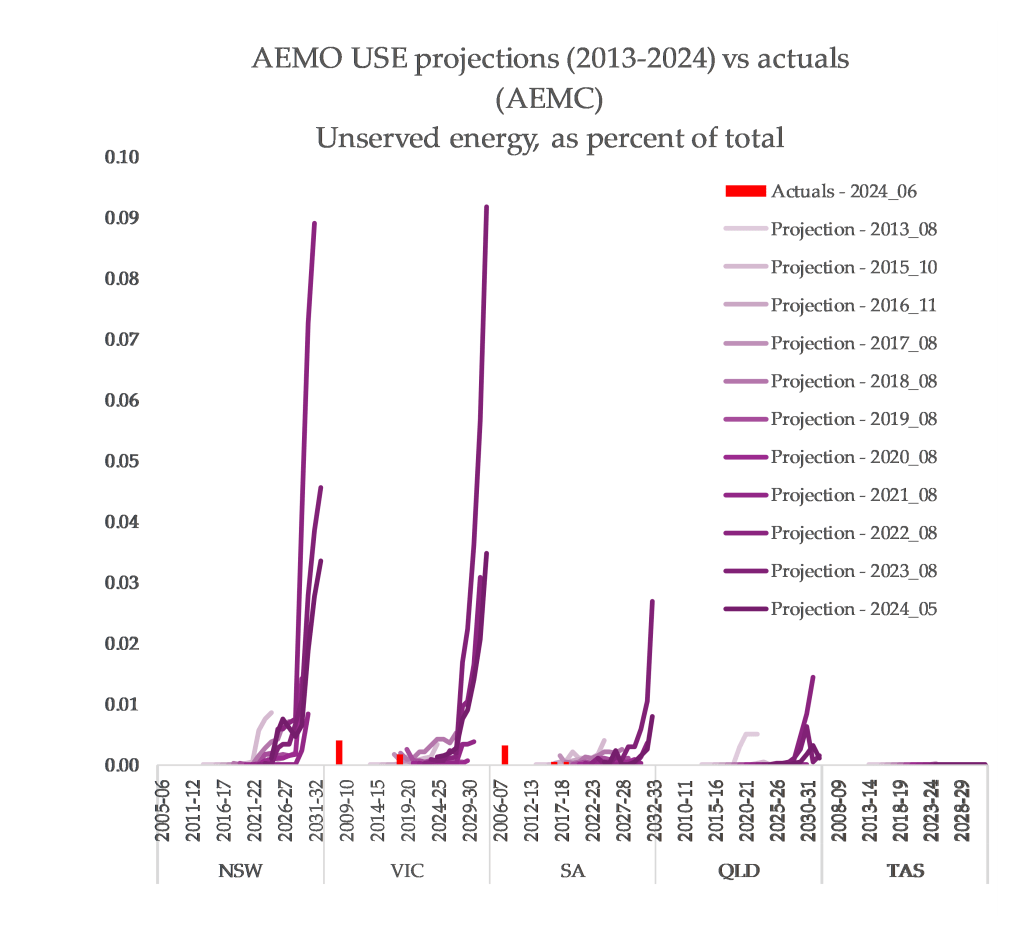
The 2022 edition of NSW’s projection breached the reliability standard of 0.02% about 10x, the highest I can find in my compilation. But each new projection since 2022 has seen this ease a fair bit, presumably thanks to several new projects entering the pipeline.
My bet is part of the reason behind this is the fact that there is too little wind and solar in the construction pipeline in Australia. You can already see in the chart above the renewable proportions beginning to waver in the past year – the Clean Energy Council’s Q1 2024 report highlights the slowdown clearly:
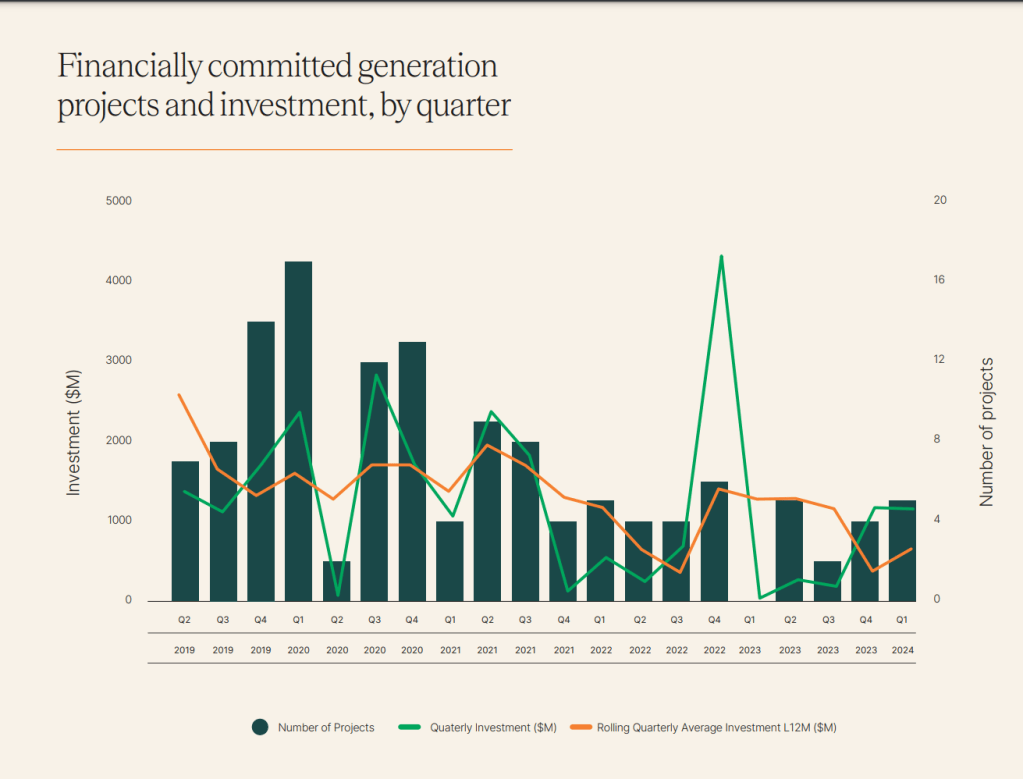
These are the ‘opportunities’ this report is meant to highlight. There will be a growing gap between supply, which is falling due to retiring coal plants, and demand, which is rising due to electrification, worsening climate impacts and data centre growth. Why isn’t Australia’s private clean energy sector answering the call?
AEMO is due to release ESOO this week. And there will definitely be headlines warning of impending blackouts. Whatever the headlines say, it is clear that a tempting option is to fall back on the most shockingly harmful polluters, like the NSW Labor party is doing as they pay coal plants to stay open past their closure dates.
All of this is happening in the context of an atmosphere that will worsen significantly in the near term. Australia has seen a few years of the ‘downswing‘ in the long-term upwards trend in temperatures – once the new ‘upswing’ hits, the power system will be more vulnerable than ever before.
There is no functional ‘early warning’ system for Australia’s power system emissions being off track in terms of the damage it’s causing society through its greenhouse gas release. We know the impact of this because Australia’s power sector emissions have been rising for more than a year now – the first time since 2017 – and very, very few people seem to care. Guess what – the new batch of emissions data is also due out this week. Which one do you think will get more attention?
- Allan O’Neill’s explainer in WattClarity is really good: “The “Expected” qualifier on USE can be confusing because here it means statistical expectation – an average across a range of future scenarios, weighted for probability – not what AEMO thinks will definitely, or is even most likely to happen. For an analogy, the statistically expected outcome of betting $100 on red at the roulette table is a return of just under $100 – but the returns from an actual bet will be either zero (occurring just over half the time) or $200 (just under half the time). So when AEMO assesses Expected Unserved Energy for a future period to be, say, 700 MWh, this really means that in some scenarios – hopefully most – they project no load shedding, but in others, a significantly larger amount than 700 MWh would be shed” ↩︎
- You can download the raw data compilation here – please tell me if I stuffed up anywhere, it was one hell of a copy / pasting job ↩︎
- The 2016 blackout was triggered by a major and unprecedented storm that occurred in an unexpected season – certainly intensified if not completely caused by fossil fuel climate impacts ↩︎

Hi Ketan, great article. One trend/topic that it could be fun to explore here is the potential for minimum demand to impact reliabity in the future. The ISP, VSOO and ESOO will start to document the affects of excess solar feeding into the network during Spring and Autumn. We will get a “peakier” network with more troughs as consumers and industry electrify and adopt distributed PV. The need for storage and firming capacity will become really important to ensure both reliability and quality of supply. Keep on writing and fighting the good fight!
LikeLiked by 1 person